Ficheiro:Price elasticity of demand and revenue.svg

Dimensões desta antevisão em PNG do ficheiro SVG: 215 × 320 píxeis Outras resoluções: 161 × 240 píxeis | 322 × 480 píxeis | 516 × 768 píxeis | 688 × 1 024 píxeis | 1 376 × 2 048 píxeis.
Ficheiro original (ficheiro SVG, de 215 × 320 píxeis, tamanho: 9 kB)
| Descrição |
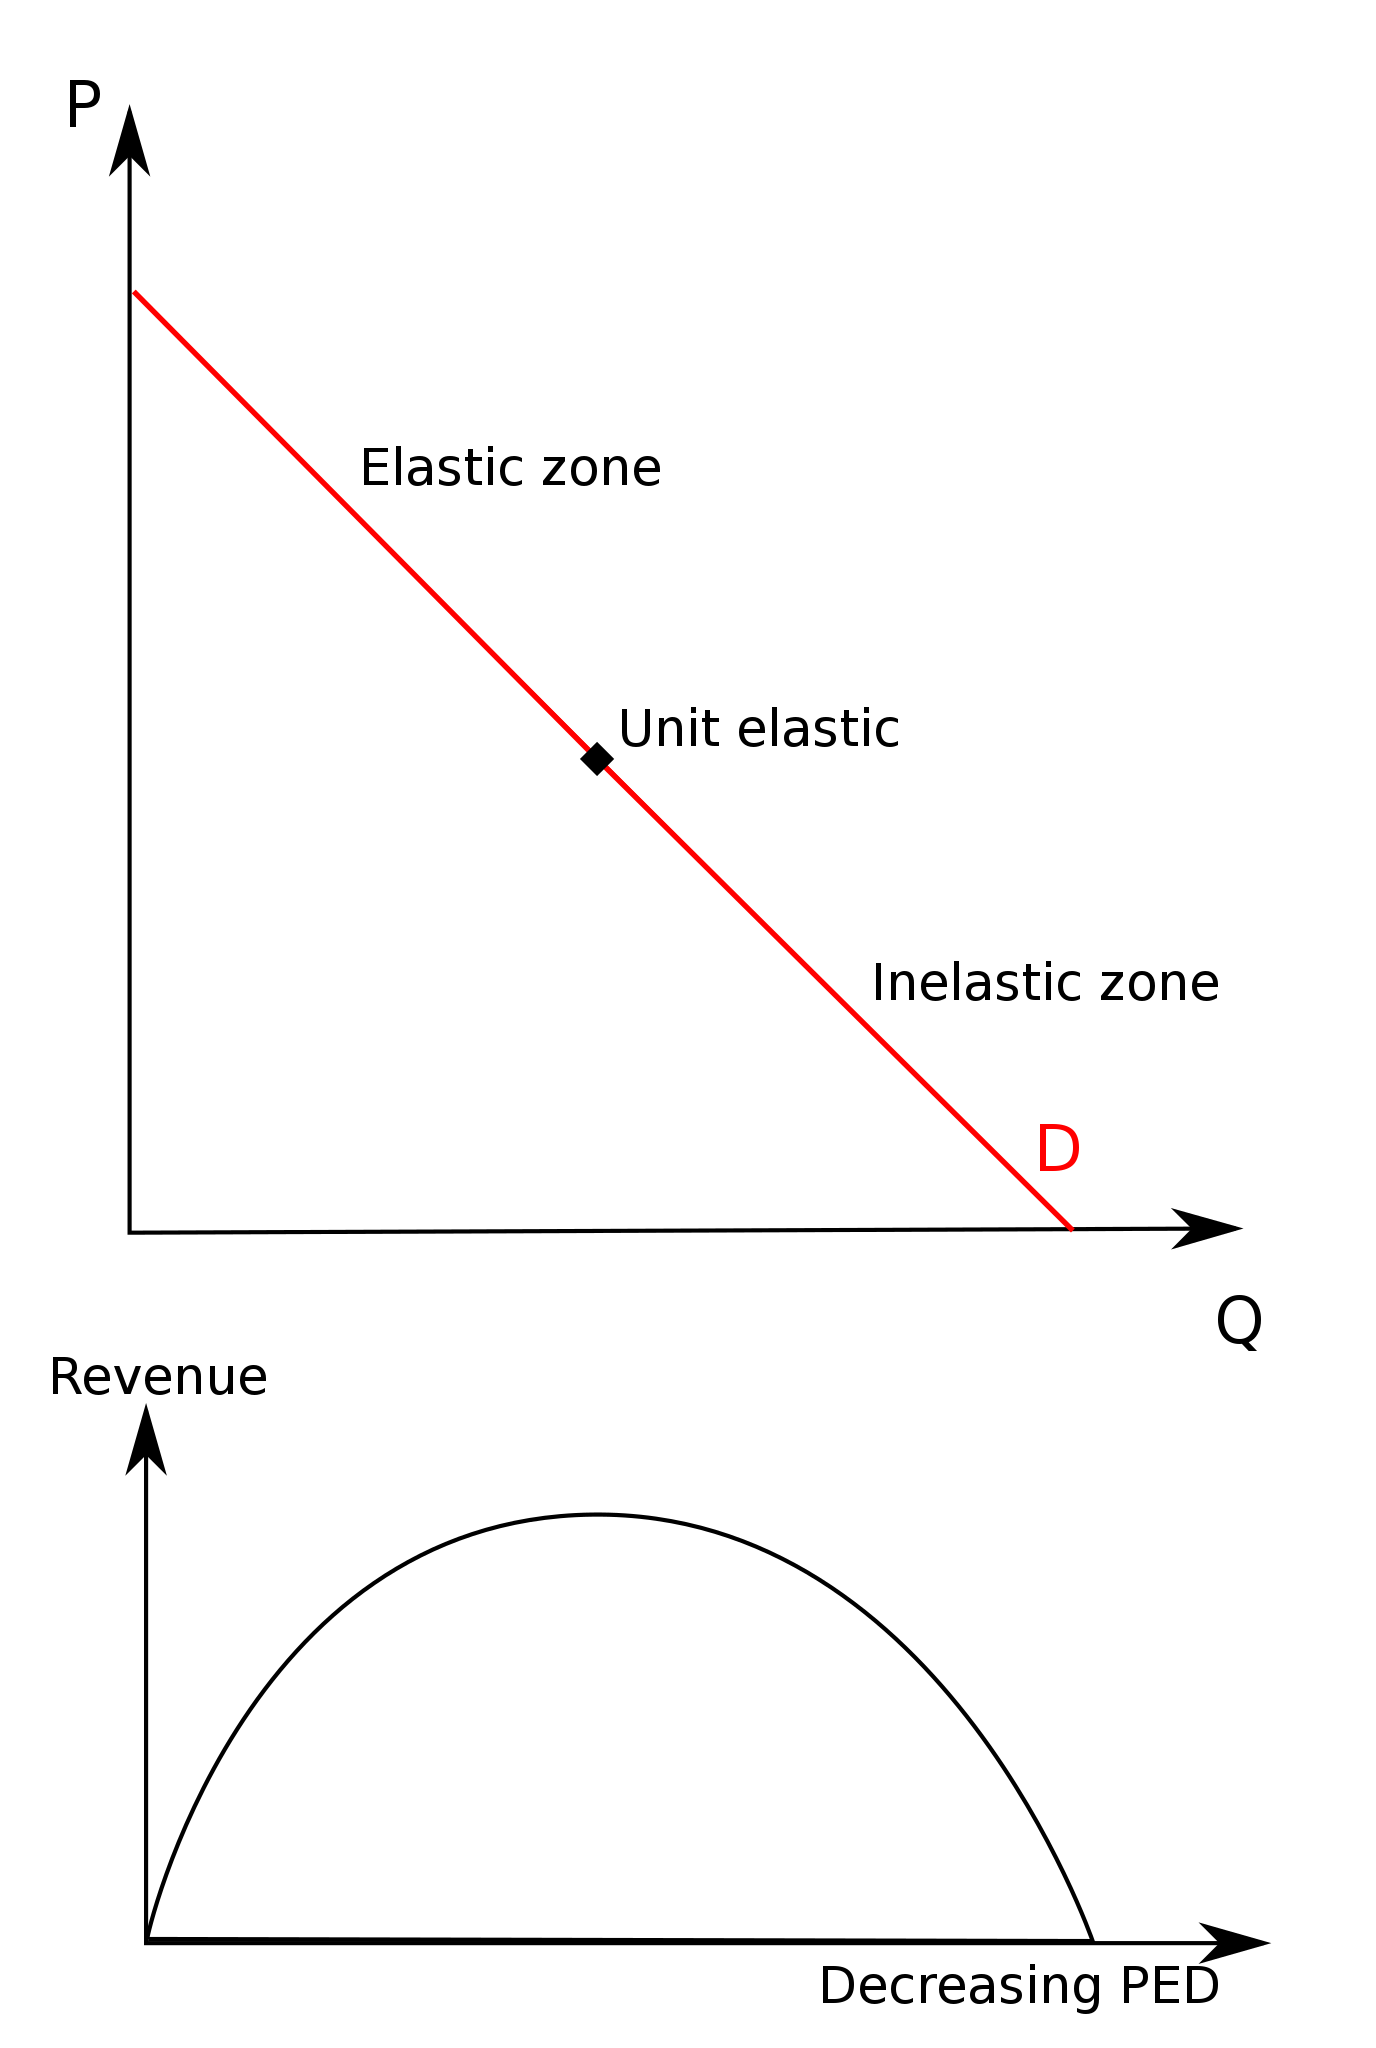
English: An SVG-ified graph showing the relationship between elasticity and revenue. Such graphs are common when explaining this relationship; for an interactive Java applet demonstrating the concept, see [1]. A chart showing total revenue (but not an associated demand curve) is also available in Pashigian, Peter B. (1998). Price Theory and Applications. McGraw-Hill. ISBN 0070487782. Note: not as strictly accurate as original file. |
| Data | (UTC) |
| Origem | |
| Autor |
|
Eu, titular dos direitos de autor desta obra, publico-a com as seguintes licenças:
| A utilização deste ficheiro é regulada nos termos da licença Creative Commons - Atribuição-CompartilhaIgual 3.0 Não Adaptada. Sujeito a aviso legal (disclaimer). | ||
| ||
| Esta marca de licenciamento foi adicionada a este ficheiro durante a atualização da licença GFDL. |

|
É concedida permissão para copiar, distribuir e/ou modificar este documento nos termos da Licença de Documentação Livre GNU, versão 1.2 ou qualquer versão posterior publicada pela Free Software Foundation; sem Secções Invariantes, sem textos de Capa e sem textos de Contra-Capa. É incluída uma cópia da licença na secção intitulada GNU Free Documentation License. Sujeito a aviso legal (disclaimer). |
Pode escolher a licença que quiser.
Registo de carregamento original
This image is a derivative work of the following images:
- File:Price_elasticity_of_demand_and_revenue.png licensed with Cc-by-sa-3.0-migrated, Cc-by-sa-3.0-migrated-with-disclaimers, GFDL, GFDL-en
- 2010-02-28T15:06:27Z File Upload Bot (Magnus Manske) 430x505 (7871 Bytes) {{BotMoveToCommons|en.wikipedia|year={{subst:CURRENTYEAR}}|month={{subst:CURRENTMONTHNAME}}|day={{subst:CURRENTDAY}}}} {{Information |Description={{en|A graph showing the relationship between elasticity and revenue. Made by
Carregada com derivativeFX
Histórico do ficheiro
Clique uma data e hora para ver o ficheiro tal como ele se encontrava nessa altura.
| Data e hora | Miniatura | Dimensões | Utilizador | Comentário | |
|---|---|---|---|---|---|
| atual | 15h22min de 28 de fevereiro de 2010 | | 215 × 320 (9 kB) | Jarry1250 | Sorry, uploaded wrong version. This one has the correct labels. |
| 15h14min de 28 de fevereiro de 2010 |  | 215 × 320 (7 kB) | Jarry1250 | {{Information |Description={{en|An SVG-ified graph showing the relationship between elasticity and revenue. Such graphs are common when explaining this relationship; for an interactive Java applet demonstrating the concept, see [http://www.econtools.com/j |
Utilização local do ficheiro
A seguinte página usa este ficheiro:
Utilização global do ficheiro
As seguintes wikis usam este ficheiro:
- Uso no domínio de.wikipedia.org
- Uso no domínio en.wikipedia.org
- Uso no domínio es.wikipedia.org
- Uso no domínio ja.wikipedia.org
- Uso no domínio pt.wikibooks.org
- Uso no domínio si.wikipedia.org
- Uso no domínio uk.wikipedia.org
- Uso no domínio uz.wikipedia.org